

What Is Data Storytelling Training and Why It Matters
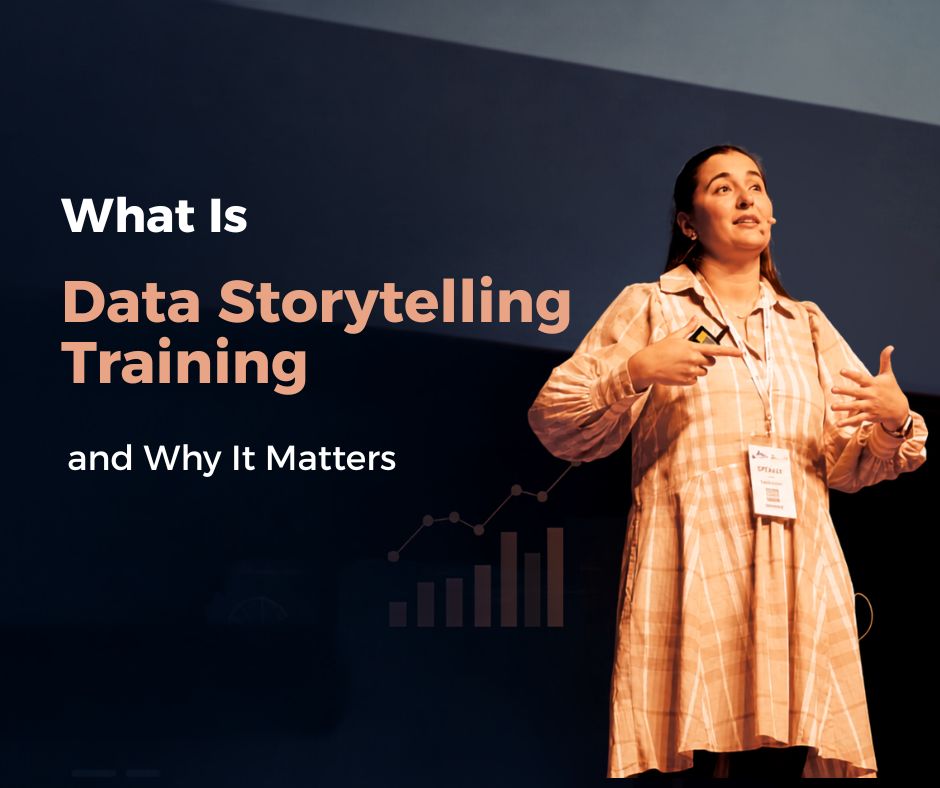
I still remember sitting in a boardroom years ago, watching a brilliant analyst present a dashboard packed with numbers nobody in the room understood. The data was solid. The insight was there. But by the third slide, half the executives had checked out on their phones. That moment stuck with me not because the analysis was wrong, but because nobody had taught the analyst how to tell the story behind it. That’s the gap corporate data storytelling training exists to close.
What Is Data Storytelling?
At its core, data storytelling is the practice of combining data, visuals, and narrative to communicate insights in a way people actually remember and act on. It’s not just about making a chart look nice. It’s about answering the question every decision-maker silently asks: “So what?”
In my experience running workshops on this exact topic, I’ve noticed that most people confuse data storytelling with data visualisation. They’re related, but they’re not the same thing. More on that shortly. Storytelling in corporate training environments has become one of the fastest-growing focus areas because organisations are drowning in data but starving for insight. A 2023 Gartner survey found that only a small fraction of data and analytics leaders felt their teams had strong data communication skills, despite significant investment in analytics tools. The tools improved. The storytelling didn’t.
Turning Raw Data Into Insights People Actually Understand
Raw data, on its own, is meaningless to most audiences. A spreadsheet of churn rates or quarterly sales figures doesn’t move anyone emotionally or logically until it’s framed around a human problem. This is where structured data storytelling training earns its keep.
I’ve watched teams take the exact same numbers and present them two completely different ways. One version reads like a technical report. The other opens with “Here’s what’s costing us three million dollars a year” and suddenly everyone leans forward. Same data. Wildly different impact. Good training teaches professionals to lead with the “why it matters” before the “how we got here”, which sounds simple but is genuinely hard to do under pressure.
How Structured Training Helps Teams Communicate Data Clearly
Here’s something I don’t think gets said enough: data storytelling isn’t a soft skill you either have or don’t. It’s teachable, and it’s teachable in a structured way. A well-designed data storytelling course usually walks through audience analysis, narrative arc, visual hierarchy, and message framing in that order, not randomly.
Teams that go through formal training tend to stop dumping every metric onto a slide “just in case someone asks” Instead, they learn to build towards one central message and support it with two or three supporting data points, not twenty. It’s a discipline thing as much as a creative one.
Bridging the Gap Between Numbers and Narrative
Numbers persuade the logical brain. Stories persuade the emotional one. Most business decisions, uncomfortably enough are made with both. I’ve sat across from finance directors who could recite exact figures but still couldn’t tell me why those figures mattered to the business strategy. That disconnect is what training aims to fix.
Bridging that gap usually comes down to structure: setting up context, introducing tension (the problem the data reveals), and resolving it with a clear recommendation. It’s basically the same shape as any good story you learnt in school, just applied to a revenue chart instead of a novel.
What Skills Do You Learn in Data Storytelling Training?
A solid programme typically covers the following:
- Framing a clear, singular message before touching any chart
- Choosing the right visualization for the right data (and knowing when not to use a chart at all)
- Structuring a narrative arc: setup, insight, action
- Simplifying technical jargon for non-technical stakeholders
- Presenting with confidence, including handling pushback on the data itself
Some programmes go further into tools, dashboards, BI platforms and presentation software but honestly, the strongest sessions I’ve been part of spend more time on thinking clearly than on clicking buttons.
Helping Teams Make Data-Driven Decisions Through Better Communication
When communication improves, decision-making speeds up. That’s not a marketing line; it’s something I’ve seen play out repeatedly. Meetings that used to spiral into “Wait, what does this number even mean?” Conversations start moving towards “Okay, what do we do about it?” conversations instead.
Organisations that invest in this kind of training, whether through an internal data literacy webinar series or bringing in an outside data-storytelling speaker, often report that cross-functional teams start trusting the data more, simply because they finally understand it.
The Missing Skill in Most Data Teams
If I had to name the one skill most technically brilliant data teams lack, it’s this: knowing their audience isn’t them. Analysts are trained to think in queries, models, and statistical significance. Executives think in outcomes, risks, and opportunities. Without training, that translation layer just doesn’t exist.
This is, honestly, the most overlooked insight in most articles on this topic, it’s rarely framed as a translation problem rather than a presentation problem. Once teams start treating it that way, the fix becomes much more obvious: build a “translator” mindset into every analyst, not just the team lead who does the final presentation.
Data Storytelling vs Data Visualisation: What’s the Difference?
People use these terms interchangeably, and it causes real confusion. Data visualisation is the ‘how’ of charts, graphs and dashboards, the visual representation of numbers. Data storytelling is the ‘why’ and ‘so what’ – the narrative that gives those visuals meaning and direction.
You can have gorgeous visualisations and still fail to communicate anything useful if there’s no story tying them together. Conversely, a rough hand-drawn chart with a sharp narrative can outperform a polished dashboard every time. Neither replaces the other; they work best together, which is exactly why most comprehensive training programmes teach both side by side.
How to Get Started With Data Storytelling
You don’t need a big budget or a formal programme to start. Honestly, the fastest way I’ve seen people improve is by taking one report they already present regularly and rebuilding it around a single sentence: “What’s the one thing I want people to remember?” Everything else in the presentation should support that sentence, and anything that doesn’t gets cut.
From there, it helps to get some structure around it. A short data literacy webinar is a low-commitment way to test the waters before committing to a full course. Listening to a data talk podcast on your commute works too; you’d be surprised how much of this sticks just from hearing other practitioners talk through real examples. If you’re further along and want something more hands-on, a dedicated data storytelling course with feedback on your actual presentations tends to move people forward faster than reading alone. And if your organisation has the budget, bringing in a data storytelling speaker for a team session can shift the whole team’s mindset in a single afternoon; I’ve seen it happen.
The key thing is momentum. Pick one habit, apply it to your next presentation, and build from there. Trying to overhaul everything at once usually backfires.
Unlock the Power of Data Storytelling Today
Here’s the honest truth: the organisations getting the most value out of their data aren’t necessarily the ones with the fanciest tools. They’re the ones whose people can explain what the data means in a way that actually changes minds. That’s a skill gap and skill gaps close with practice and the right guidance.
If this article has you thinking about the reports your team sends out or the meetings that lose the room halfway through, that’s usually a sign it’s worth investing in this properly rather than hoping it improves on its own.
Final Thoughts
The data storytelling training isn’t about turning analysts into performers. It’s about making sure good insights don’t die quietly in a spreadsheet nobody opens twice. If your team has great data but struggles to get buy-in. The missing piece usually isn’t more analysis, it’s better storytelling.
If you’d like to explore this further, Selena Fisk offers data storytelling courses, speaking engagements, and resources designed specifically for business professionals looking to bridge that exact gap between numbers and narrative.
FAQs
Is data storytelling training only useful for data analysts?
Not at all. Marketers, educators, and business leaders benefit just as much, since anyone who needs to influence a decision using data is, technically, telling a data story.
How long does it typically take to learn data storytelling?
Foundational skills can be picked up in a focused course or workshop over a few days, though genuine fluency develops over months of applying it to real presentations.
What’s a good starting point if I’m new to this?
A well-regarded data storytelling book paired with a hands-on course or webinar tends to work better than either alone theory plus practice.
Do I need advanced technical skills to take a data storytelling course?
No. Most programmes are designed for people with basic data literacy, not statisticians or engineers.
How is corporate data storytelling different from general presentation skills?
It specifically focuses on translating quantitative insight into narrative, whereas general presentation training covers broader public speaking and slide design.
